

Debug Faster Watching Embedded Firmware & Hardware in Real-Time
The debugger that shows exactly what your firmware, hardware, and power are doing, when they do it, and why they fail.

Seeing Inside Firmware Matters
Logic Analyzers & Oscilloscopes Only Show Symptoms. Active-Pro Shows the Cause.


Meet the new
Active-Pro Debugger & Logic Analyzer
Active-Pro combines a high-performance logic analyzer with real-time firmware instrumentation, giving you:
Full visibility of firmware events without halting code.
10x faster debug cycles with automatic channel setup
Time-correlated traces linking code to actual hardware signals.
A tool that works where traditional analyzers and JTAG stop helping.
Debugging now at:

Step 1:
Instrumentation, Re-Imagined with Near-Zero Firmware Impact
Instrument your Firmware

Press Capture

Why It’s Different
This is not your old slow UART-based printf. The Active-Pro uses the Active Debug Port, a high-clock-rate debug interface that delivers sub-microsecond output so instrumentation runs alongside your firmware instead of interrupting it. Clock and data lines are automatically sensed for quick low-risk hookup, MCU hardware blocks like SPI can stream debug data with minimal CPU involvement, and a highly-compressed protocol maximizes USB bandwidth to capture firmware timing, logic, analog, and hardware behavior together. Setup in the PC app is fully automatic, with every firmware output appearing on its own waveline, auto-scaled to the viewing window and automatically labeled, so debugging is as simple as adding a line of firmware and pressing capture with no configuration and no wasted debug cycles.
Step 2:
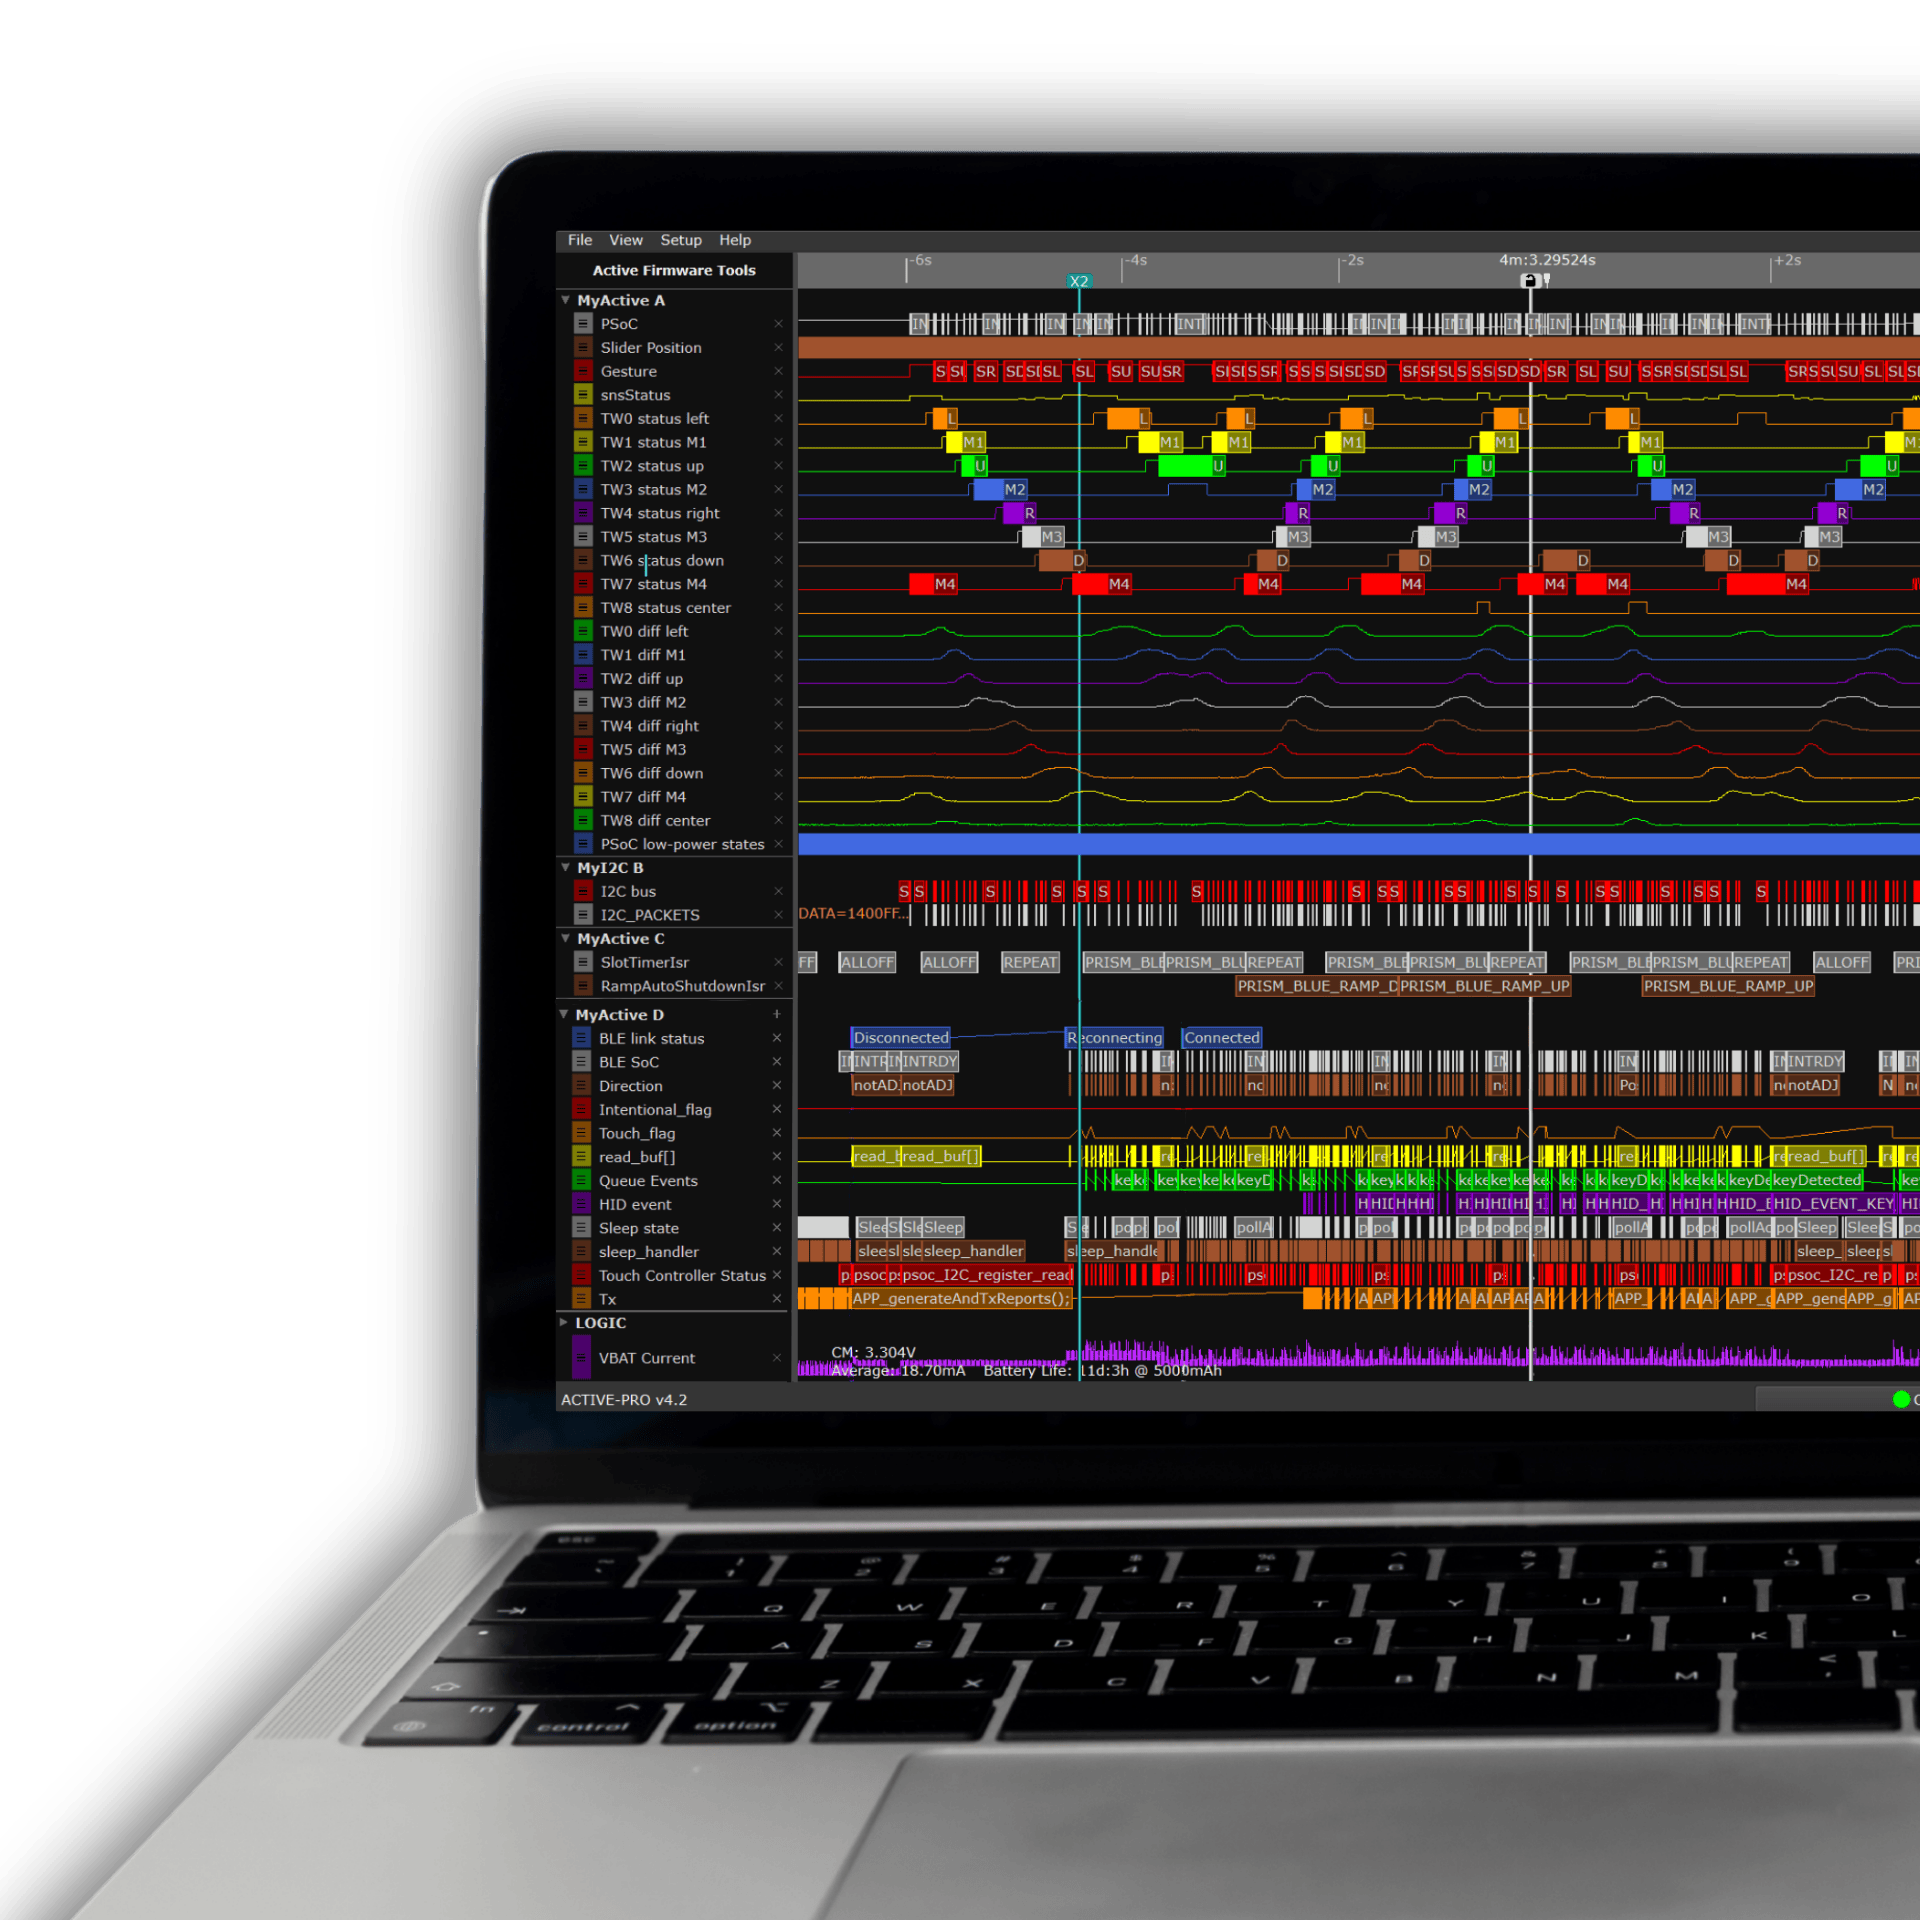
See Cause and Effect Across Your Entire System
Firmware debug output, transitions, states, hardware signals, and bus activity captured in sync, visualized live. Whether you're working on a single or multiple MCUs and FPGAs, it all lines up in one beautiful timeline.
Watch Firmware Algorithms
The Active-Pro Debugger shows live internal variables as your algorithm runs, so you can focus on the actual computation, not just the outputs. It’s built to help you fine-tune sensor processing and troubleshoot issues fast by giving you a real-time view into what your code is doing.
See Firmware States and Variables
Viewing firmware debug output alongside hardware signals on a synchronized timeline shows exactly what your system is doing and when. You can instantly see the cause and effect between your code, I/O, and communication events, even across multiple processors, making deep firmware issues much faster to isolate and fix.
Analyze Buses Inside and Out
The Active-Pro Debugger lets you see both sides of the communication, what's happening on the bus and what your firmware is doing to send and receive it. By combining external signal monitoring with internal trace points, it exposes issues between processors and FPGAs that traditional tools miss.
Measure Current and Hardware Signals
The Active-Pro Debugger links source code to current changes during power mode transitions, so you can see exactly what code is running as power ramps up or down. It shows real-time power behavior, helping you tighten up power management code and improve reliability—especially in battery-powered systems.
Debug Multiple Processors and FPGAs in Real-Time
The Active-Pro Debugger streams all data to disk so you can capture long test cycles without missing anything. While recording, it gives you a live view of system behavior and overlays multiple data streams for full context. It’s built for tough environments like automotive and aerospace, where catching rare issues fast matters.
Watch Hands-On Debugging of Multiprocessor Embedded Systems Firmware & Hardware
In this video, we explore the unique challenges of debugging multiprocessor embedded systems, where timing and inter-processor communication can make bugs almost impossible to reproduce with traditional tools. You’ll see how the Active-Pro Debugger gives you real-time visibility across multiple processors and buses, making it easier to track down race conditions, synchronization problems, and unexpected interactions with confidence.
Debug Faster with Firmware and Hardware on the Same Timeline

The Active-Pro gives you the visibility other tools miss, helping you solve bugs faster, ship cleaner firmware, and become the engineer everyone counts on. Get yours today.

Solve Bugs Faster
Engineer-to-Engineer Support
1-Year Warranty
30-Day Money-Back Guarantee