active-debugger-background.jpg

“Hey, Let Your Firmware Speak!”

Master the Art of Print Debugging

See Inside Firmware in Real-Time, Capture the Bugs You’re Missing, and Simply Debug Faster

Meet the Active-Pro Debugger & Logic Analyzer

The Best Tool to Debug Embedded Firmware & Hardware in Real-Time

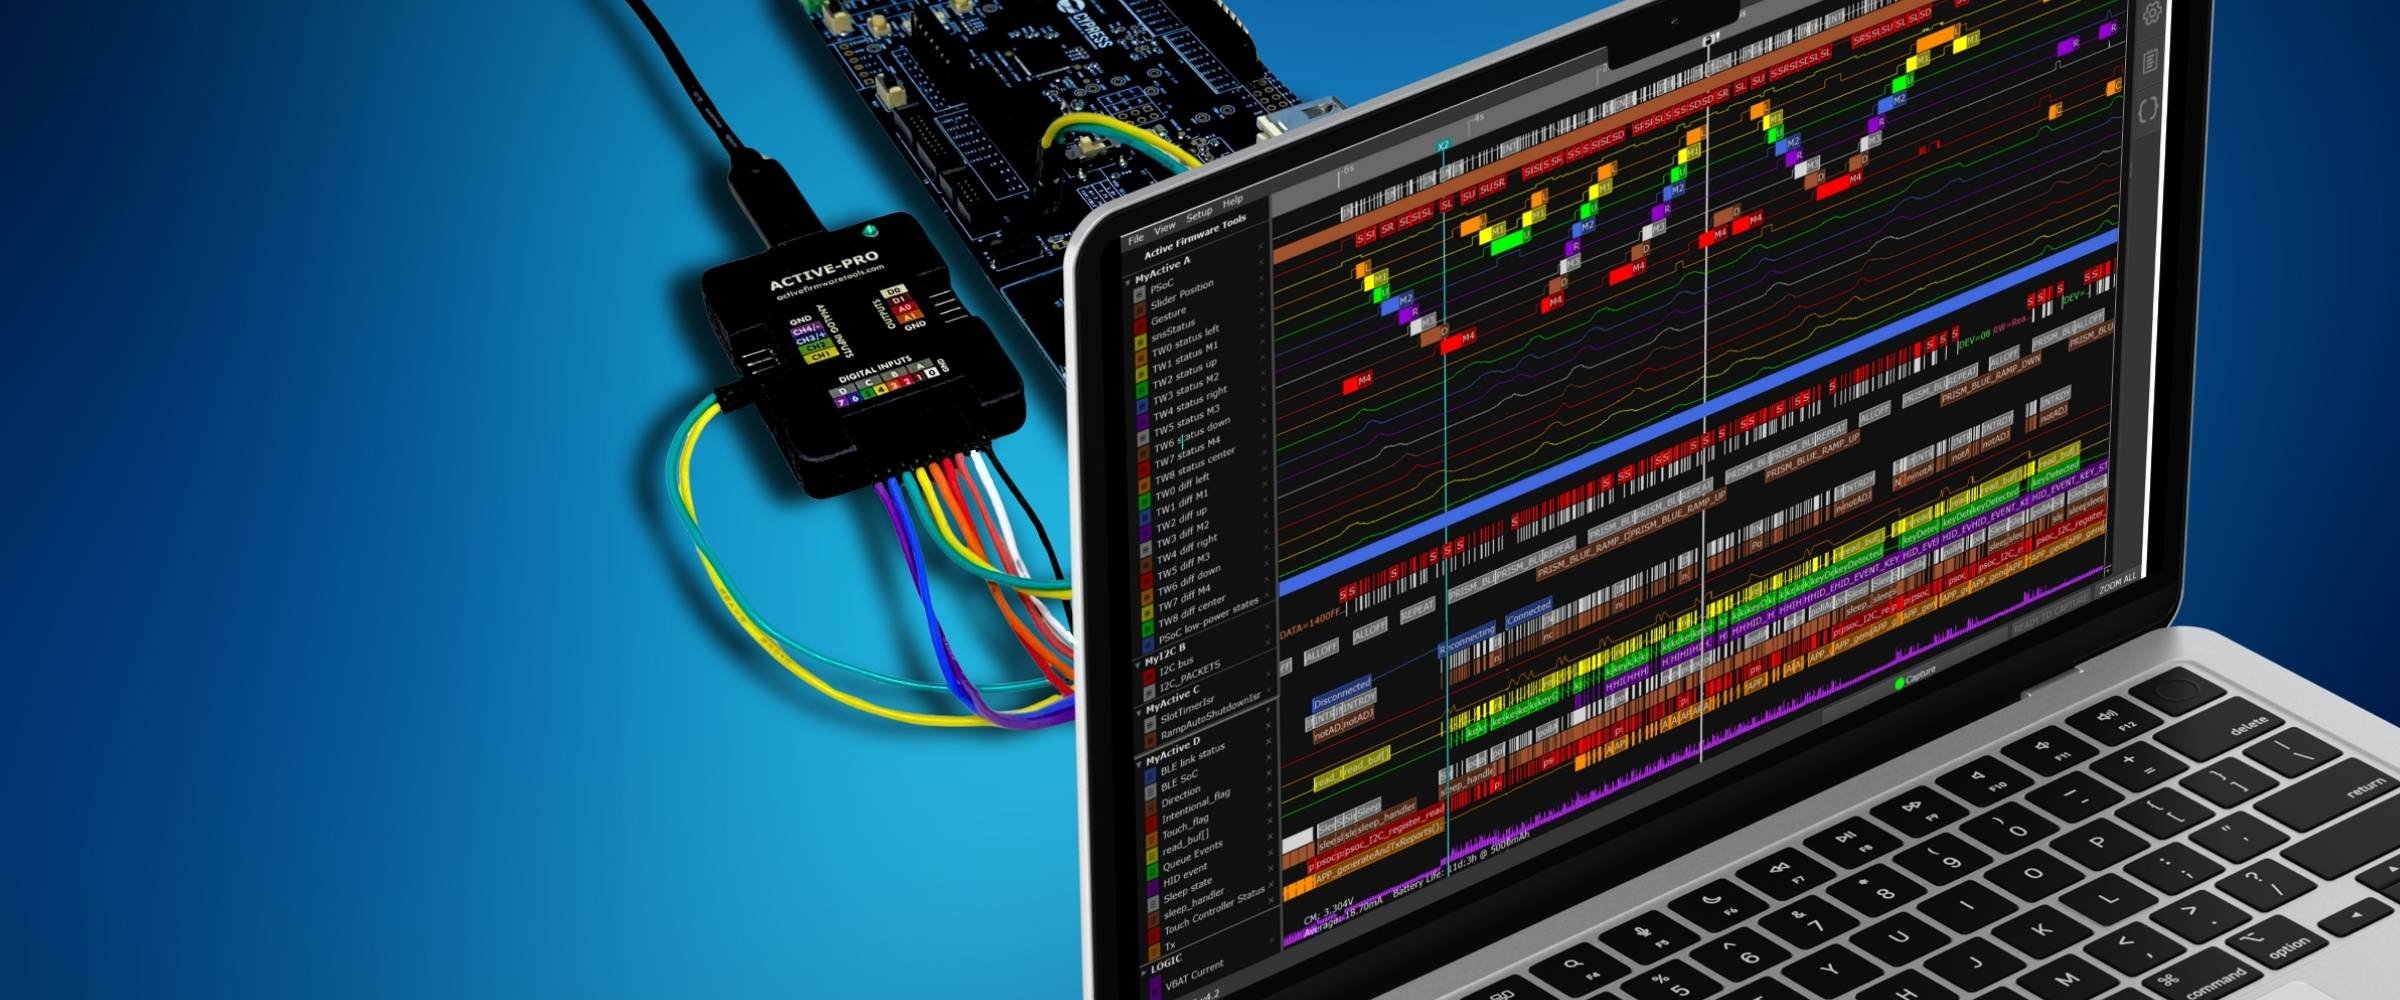
The Active Firmware Tools Debuggers and Logic Analyzers accelerate embedded firmware and hardware debugging by providing real-time visibility into your design with automatic graphing of variables and debug output from within your embedded microprocessors and FPGAs. Advanced models can debug multiple processors, capture digital and analog signals, decode bus traffic, monitor live current and display them all simultaneously on one screen. Crafted for the professional embedded firmware engineer, the Active Debuggers and Logic Analyzers give you the exact data you need to make smart decisions quickly.

“Anyone who writes firmware NEEDS this! I was able to immediately find an issue with my multi-processor application... I love my Active-Pro!”

Troy Gentry - Field Applications Engineer - Infineon Technologies

Why the Active-Pro is Better

  • See exactly what is happening in your firmware in real time on multiple microprocessors and FPGAS.

  • Get the complete picture of what is actually happening in your embedded design in real-time, without breakpoints, in real world testing.

  • Upgrade to the Active-Pro and effortlessly handle compressed debug data from up to four processors simultaneously, showing complex interactions between them.

  • Beyond traditional text debug output, Active Debuggers automatically graph variable data across multiple channels, offering unparalleled data visualization and analysis.

  • Connect trace events directly to the corresponding source code for faster embedded firmware development.

  • Interfaces to any processor or FPGA for all of your current and future embedded development

Zoom Into Your Embedded Design

Go Inside Interprocessor Communications

The Active-Pro Debugger provides a complete view of system communications by combining external bus monitoring with real-time visibility into the transmit and receive routines within firmware. This capability is crucial for solving complex communication issues between processors and FPGAs, as it allows engineers to analyze both the external data flow and the internal processes driving it, uncovering bugs that are otherwise difficult to diagnose.

Watch Live State Transitions

The Active-Pro Debugger enables real-time monitoring of state transitions without halting system operation, making it ideal for applications like wireless communication, motor control, or systems dependent on real-world inputs. Unlike traditional debugging with breakpoints, it allows engineers to observe state changes as they happen, preserving critical context and environmental interactions to reveal the exact root cause of complex bugs.

See Code Impacting Power Usage

The Active-Pro Debugger simplifies power optimization by correlating source code with current changes during power mode transitions. Engineers can visualize the sequence and timing of power up and down events in real time, making it easier to refine power management code for efficient transitions. This ensures better power schemes and improves overall system reliability, especially in battery-powered devices.

Capture Real-Time Status Over Long Periods

The Active-Pro Debugger captures long test cycles by streaming all data to disk while providing real-time monitoring of system behavior. Designed for demanding applications like automotive and aerospace, it overlays multiple data streams for a complete view, enabling quick detection and resolution of anomalies and ensuring reliable operation.

Graph Algorithm Variables

The Active-Pro Debugger accelerates algorithm development by displaying live, real-time internal variables as they compute data, allowing engineers to focus on critical internal components rather than external reactions. Its tools for visualizing and analyzing sensor data in real time make it easier to fine-tune algorithms and troubleshoot sensor-related issues.

Easy as 1, 2, …

Yes, just 2

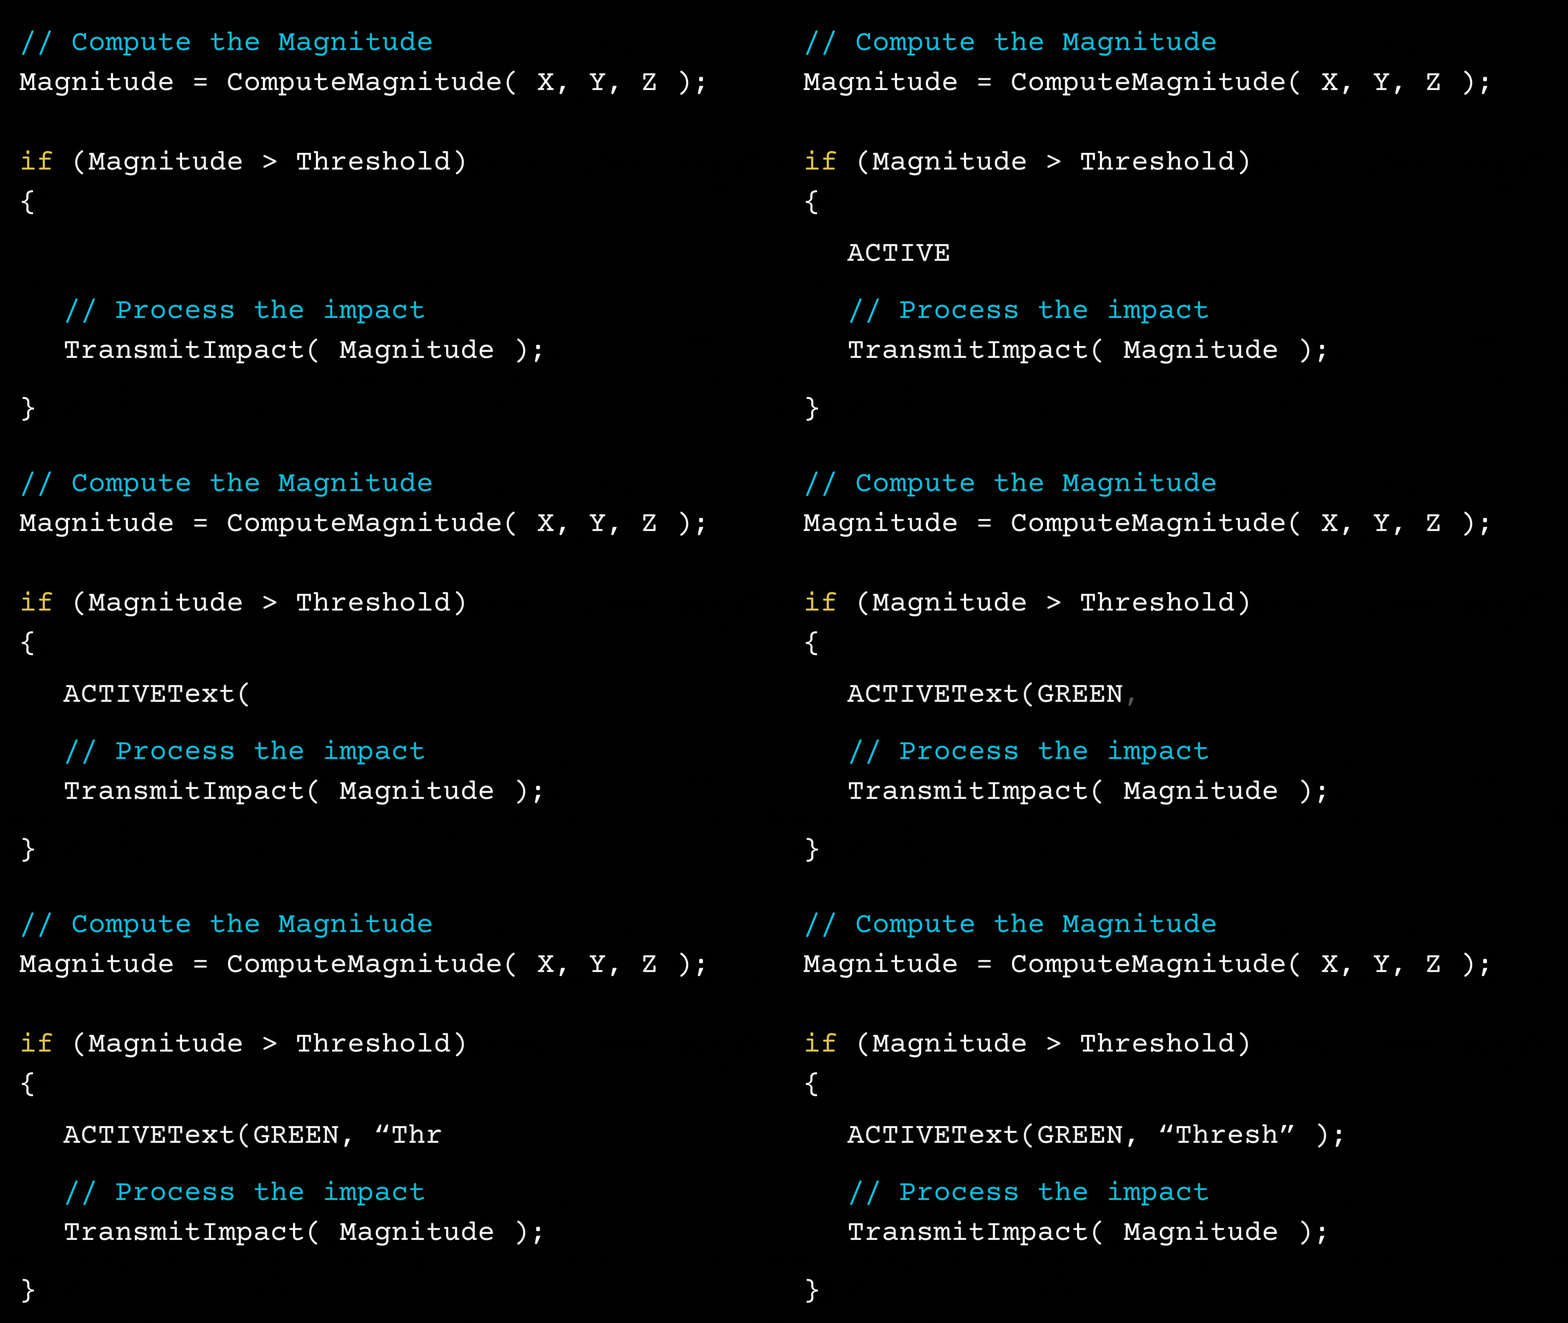
Step 1: Add a Line of Code

To output the exact debug data you need - text or graphed variable data

Step 2: Press Capture

And the Active Debugger automatically captures the debug data, organizes the screen as the data streams in, and displays it in an intuitive and easy to understand format.

Active-Pro Debugger & Logic Analyzer

Find and fix bugs faster with live, real-time graphs of debug output, variables, and system state from multiple processors or FPGAs. Synchronized with source code, hardware signals, buses, and current, it shows you exactly what’s causing your bugs to occur.

  • See Inside Your Firmware in Real-Time

  • Capture Variables, Debug Output, Logic, Analog, Busses, and Current

  • Debug Multiple Processors or FPGAs Simultaneously

  • Automatically Graph Internal Variables

  • Trace Events to Source Code

  • Use on Any Processor or FPGA

Technical Details

  • Captures data on the new Active Debug Port interface that sends debug data from your processor to our capture engine. It allows each processor to display debug text and graphed variables in real-time on multiple channels timestamped to nanosecond resolution.

    The debug data is synchronized with all other digital and analog inputs and busses, graphed in real time, and supports up to 4 separate processors simultaneously.

    • Advanced Micro Devices AM - P87 - ELAN...

    • Analog Devices - Maxim Integrated - Dallas Semiconductor ADuC - MAXQ - Crimzon - DARWIN - DeepCover - DS - fido - Zatara...

    • Arduino

    • ARTERY AT32...

    • Atmel SAM...

    • EM Microelectronic EM...

    • Epson S1C...

    • Espressif ESP32...

    • Fairchild Semiconductor ACE...

    • Geehy Semiconductor APM32F...

    • Harris RTX200...

    • Himax HX65...

    • Honeywell HT83C51...

    • Infineon - Cypress EZ-USB - PSoC3 - 4 - 5 - 6...

    • Intel 87 - 8x - M87 - MCS...

    • Lantiq SAFC165...

    • Luminary Micro Stellaris...

    • Lumissil IS31 - IS32...

    • Microchip PIC - ATmega - ATtiny...

    • Motorola 56F - HCxx - i.MX - m68xxx - MAC - MCF - MPC...

    • National Semiconductor COP8 - CR16MF - Stellaris...

    • Nexperia ST7FLITE - MKL36 - STMP37 - S6E2...

    • Nordic nRF52 - nRF52 - nRF7002...

    • Nuvoton KM1 - N7 - NuMicro - W7 - W8 - W9 - WP...

    • NXP - Freescale 56F - HC - LPC - MFC - MPC - S32K...

    • Onsemi ACE - LC87...

    • Panasonic MN101...

    • Parallax P8X32 - P2X8...

    • Raspberry Pi Model A - Model B - 3 - 400 - 5 - Zero - Pico - RP2040...

    • Renesas H - M - Synergy - RA - RX...

    • Rohm Semiconductor ML61 - ML62...

    • Sanyo LC87...

    • Sharp LH7...

    • Siemens SAB-C501...

    • Silicon Labs AEC - EFM8 - EFM32 - Gecko - Bee...

    • SMSC MPU800...

    • Spansion S6E1 - S6E2...

    • STMicroelectronics AEC-Q100 - STM8 - STM32 - SPC5 - ST - uPSD...

    • Texas Instruments MSP430 - Stellaris - SimpleLink - C2000...

    • Toshiba TLCS - TX...

    • WIZnet W7500...

    • XMOS xcore.ai - XE - XL - XS - XU - XV...

    • Zilog ZL - Encore - eZ80 - Z8...

    • plus any other processor with 1 or 2 available GPIO pins.

    • AMD - Xilinx Spartan3 - Spartan6 - Spartan7 - Artix - Kintex - Virtex - XC - AM29CPL151...

    • Altera - Intel ACEX - APEX - Arria - Cyclone - FLEX - Mercury - Stratix...

    • Atmel AT6002 - AT40...

    • Efinix Titanium - Trion...

    • Lattice Avant - Certus - CrossLink - EC - iCE40 - iCE65 - LA - MachX - ORCA - SC - XP...

    • Lucent ATT2C...

    • Microchip - Microsemi AT40K - AT6000 - IGLOO - ProASIC - Axcelerator - EX - Fusion - MX - PolarFire - RTG - SX...

    • Quicklogic QL3P1K...

    • plus any other FPGA with 1 or 2 available GPIO pins.

    • Assembly

    • C

    • C++

    • Python

    • Micro Python

    • Java

    • Rust

    • Verilog

    • VHDL

  • The Active-Pro has Hardware Bus Decoding of data at 240Msps for blazing data capture and currently supports I2C, SPI, UART, RS232, 1-Wire, MDIO, LIN, DS101, CHSI with many more to come using our simple firmware update. The Active-Pro fully utilizes our patented Packet Presenter for displaying packets in easy to read formats.

    • SPI

    • UART..

    • I2C

    • 1-Wire

    • MDIO

    • LIN

    • RS232

    • SMBus

    • DS-101

    • CHSI

    • ACTIVE Debug Port

    • EE101 Debug Port

    • plus many more to come through easy software updates.

  • Each Active-Pro has 8 diode and fuse protected digital inputs sampling at 120Msps with variable logic thresholds that support logic families spanning from 1V to 5V logic.

  • Each Active-Pro has 4 dedicated Analog Inputs that are sampled at a maximum of 1Msps, perfect for audio, bus monitoring, power supply performance, and real-time current analysis. There are single ended and differential channels that operate through 12 and 15 -bit ADCs.

  • The Active-Pro has 2 Digital Outputs, operating at 0-3.3V with PWMs, and 2 Analog Outputs, operating at 0-3.3V with DC, Sine, Triangle, Ramp and Square Waves .

  • Supercharge your firmware debugging and testing with the Active-Pro Automation API. Our flexible API supports custom software development in any programming language and seamlessly integrates with the Active-Pro Firmware Debugger Application to give you access to all of the Active-Pro features. The Active-Pro Automation API automates complex debugging tasks, making it ideal for both bench testing and large-scale production.

  • Break out the fields and packets of your own custom protocol.

  • Real time, capture and display of system current synchronized with all other hardware and firmware details.

  • Analyze debug, signal, bus, and logic data with Excel, sheets, Matlab, or any other tool

  • Digital Inputs

    • Sample Buffer Depth (limited only by disk size): > 4 Trillion

    • Digital Channels: 8

    • Digital Sample Rate for logic traces: 120 Msps

    • Digital Signal Fastest Measureable: 60MHz

    • Digital Sample Rate Hardware Decoders: 240 Msps

    • Digital Logic Families Supported: 1V to 5V variable

    • Digital Input Voltage Range: -0.5V to 6V

    • Digital Input Impedance: 1M || 10pf

    • Sample Compression: Proprietary Lossless Compression

    • Capture Time Per Gigabyte Example (1MHz I2C register read every 10 msec): 383K Seconds = 4.4 Days

    Oscilloscope Inputs

    • Analog Channels: 3 Single Ended or 2 Single Ended + 1 Differential

    • Analog Input Voltage Range: 0V to 20V, or -10V to +10V measurable, -30V to +30V tolerant

    • Analog Input Impedance: 1M || 10pf

    • Analog Sample Rate for Single Ended Channels: 1Msps

    • Analog Single Ended ADC: 12-bits

    • Analog Sample Rate for Differential Channels: 200Ksps

    • Analog Differential ADC: 15-bits

    • Dynamic Current Measurements using Differential Input

    Hardware and Software Bus Decoding

    • I2C, SPI, UART, 1-Wire, MDIO, LIN, CHSI

    • RS232 and DS101

    • I2C Decoding: Automatic Signal Detection

    • SPI Decoding: Automatic Signal Detection

    • UART/ASYNC Decoding: Automatic Baud Rate Detection

    • ACTIVE Debugger Interface: Automatic Signal Detection

    • EE101 Debugger Interface: Automatic Signal Detection

    • Internal decoder sample rate: 240Msps

    • Packet Presenter runs on all protocols Channels: Yes

    • Packet Presenter Fields Graphable: 63

    Outputs

    • Digital Channels: 2

    • Digital Output Levels: 0V, 3.3V and tri-state

    • Digital PWM Control: 0 to 100% @ 250kHz

    • Digital Drive Current: 8mA max

    • Analog Channels: 2

    • Analog Output DC Levels: 0V to 3.3V variable and tri-state

    • Analog Waveforms: Sine, Ramp, Triangle, Square

    • Analog Waveform Frequency: 62.5 to 25K Hz

    • Analog Min and Max Voltage Range: 0V to 3.3V in 0.1V steps

    ACTIVE Debugger

    • Active Debug Port Devices monitored simultaneously: 4 (A, B, C and D)

    • Active Debug Port Pins Per Device: 1 (UART) or 2 (Clock and Data)

    • Active Variables graphed per device: 64

    • Active Debug Channels per device: 64

    • Firmware Control of Active-Pro App: LED Color, Capture Start and Stop, Beep, Screen Capture and Capture Save

    • Debug Message Timestamp Resolution: 8.3ns

    Accessories Included

    • Test Leads: 19

    • Test Clips: 19

    • USB-C Cable

    • Storage Case

    Physical

    • Size: 1.8" x 2.2" x 0.45"

    • Weight: 0.7 oz

    PC Connection and Power

    • Windows, Mac and Linux

    • Connection and Power: USB-C

    • Connection Throughput: 480Mbps

    • Power Consumption: 120 mA at full throttle

    • Data Capture: Stream directly to disk

    • Overcurrent Protection: 3 Resettable Polyfuse

See when

sensors saturate.

states change.

initialization fails.

FPGAs load.

transfers complete.

CRCs mismatch.

events fire.

algorithms fail.

packets aren't received.

interrupts trigger.

I/O changes.

timers wrap.

current spikes.

buffers overflow.

DMAs start.

context switches.

variables change.

contention occurs.

stacks overflow.

loops block.

exceptions happen.

signals fail.

serial data corrupts.

firmware hangs.

watchdogs reset.

power droops.

I2C misbehaves.

transfers collide.

SPI reads.

sensors glitch.

ADCs shift.

GPIOs toggle.

writes fail.

leaks start.

loops stall.

arbitration fails.

transfers fail.

calls block.

erases fail.

transactions overlap.

boot fails.

voltage dips.

sync fails.

interfaces timeout.

states change.

PLL locks.

peripherals conflict.

busses overflow.

thresholds breach.

flags set.

calibration fails.

events trigger.

sleep malfunctions.

state machines glitch.

interrupts miss.

registers reset.

“This is a fantastic tool. I wish I had this 20 years ago. I'm surprised no MSO or logic analyzer has this kind of capability. Kudos to you for developing this."

Phil Salisbury - Principal Engineer - Rimage Corporation

Open Source

Active Debugger

With our Open-Source design, see your bugs as they happen with live graphs of internal variables, states, and precise debug message timing. Understand exactly what’s causing issues in real-time so you can fix them quickly and create a solid and reliable embedded design.

  • Debug a Single Processor or FPGA

  • See Inside Your Firmware in Real-Time

  • Capture Variables, States and Debug Output

  • Automatically Graph Internal Variables

  • Trace Events to Source Code

  • Use on Any Processor or FPGA

Technical Details

  • Captures data on the new Active Debug Port interface that sends textual and value debug data from your processor to our capture engine. It allows your processor to display debug text and graphed variables in real-time on multiple channels timestamped to nanosecond resolution and cross reference the actual source code that caused the events.

  • Buy the ready-made Active Debugger, or dive into our Open Source design files for the entire Active Debugger and build your own.

    • Advanced Micro Devices AM - P87 - ELAN...

    • Analog Devices - Maxim Integrated - Dallas Semiconductor ADuC - MAXQ - Crimzon - DARWIN - DeepCover - DS - fido - Zatara...

    • Arduino

    • ARTERY AT32...

    • Atmel SAM...

    • EM Microelectronic EM...

    • Epson S1C...

    • Espressif ESP32...

    • Fairchild Semiconductor ACE...

    • Geehy Semiconductor APM32F...

    • Harris RTX200...

    • Himax HX65...

    • Honeywell HT83C51...

    • Infineon - Cypress EZ-USB - PSoC3 - 4 - 5 - 6...

    • Intel 87 - 8x - M87 - MCS...

    • Lantiq SAFC165...

    • Luminary Micro Stellaris...

    • Lumissil IS31 - IS32...

    • Microchip PIC - ATmega - ATtiny...

    • Motorola 56F - HCxx - i.MX - m68xxx - MAC - MCF - MPC...

    • National Semiconductor COP8 - CR16MF - Stellaris...

    • Nexperia ST7FLITE - MKL36 - STMP37 - S6E2...

    • Nordic nRF52 - nRF52 - nRF7002...

    • Nuvoton KM1 - N7 - NuMicro - W7 - W8 - W9 - WP...

    • NXP - Freescale 56F - HC - LPC - MFC - MPC - S32K...

    • Onsemi ACE - LC87...

    • Panasonic MN101...

    • Parallax P8X32 - P2X8...

    • Raspberry Pi Model A - Model B - 3 - 400 - 5 - Zero - Pico - RP2040...

    • Renesas H - M - Synergy - RA - RX...

    • Rohm Semiconductor ML61 - ML62...

    • Sanyo LC87...

    • Sharp LH7...

    • Siemens SAB-C501...

    • Silicon Labs AEC - EFM8 - EFM32 - Gecko - Bee...

    • SMSC MPU800...

    • Spansion S6E1 - S6E2...

    • STMicroelectronics AEC-Q100 - STM8 - STM32 - SPC5 - ST - uPSD...

    • Texas Instruments MSP430 - Stellaris - SimpleLink - C2000...

    • Toshiba TLCS - TX...

    • WIZnet W7500...

    • XMOS xcore.ai - XE - XL - XS - XU - XV...

    • Zilog ZL - Encore - eZ80 - Z8...

    • plus any other processor with 1 or 2 available GPIO pins.

    • AMD - Xilinx Spartan3 - Spartan6 - Spartan7 - Artix - Kintex - Virtex - XC - AM29CPL151...

    • Altera - Intel ACEX - APEX - Arria - Cyclone - FLEX - Mercury - Stratix...

    • Atmel AT6002 - AT40...

    • Efinix Titanium - Trion...

    • Lattice Avant - Certus - CrossLink - EC - iCE40 - iCE65 - LA - MachX - ORCA - SC - XP...

    • Lucent ATT2C...

    • Microchip - Microsemi AT40K - AT6000 - IGLOO - ProASIC - Axcelerator - EX - Fusion - MX - PolarFire - RTG - SX...

    • Quicklogic QL3P1K...

    • plus any other FPGA with 1 or 2 available GPIO pins.

    • Assembly

    • C

    • C++

    • Python

    • Micro Python

    • Java

    • Rust

    • Verilog

    • VHDL

  • Digital Inputs

    • Sample Buffer Depth (limited only by disk size): > 4 Trillion

    • Digital Channels: 2

    • Maximum Active Debug Port Clock: 14MHz

    • Digital Logic Families Supported: 1V to 5V variable

    • Digital Input Voltage Range: -0.5V to 20V

    • Digital Input Impedance: 200K || 10pf

    • Sample Compression: Proprietary Lossless Compression

    ACTIVE Debugger

    • Active Debug Port Devices monitored simultaneously: 1

    • Active Debug Port Pins Per Device: 2 (Clock and Data)

    • Active Variables graphed per device: 64

    • Active Debug Channels per device: 64

    • Firmware Control of Active-Pro App: Capture Start and Stop, Beep, Screen Capture and Capture Save

    • Debug Message Timestamp Resolution: 8.3ns

    Accessories Included

    • Test Leads: 3

    • Test Clips: 3

    • USB-C Cable

    Physical

    • Size: 0.6" x 1.8" x 0.25"

    • Weight: 0.2 oz

    PC Connection and Power

    • Windows, Mac and Linux

    • Connection and Power: USB-C

    • Connection Throughput: 12Mbps

    • Power Consumption: 20 mA at full throttle

    • Data Capture: Stream directly to disk

    • Overcurrent Protection: Resettable Polyfuse

A Few of Our Customers

See Bugs Fast. Solve Bugs Faster.

Active Debugger
Sale Price:$49.50 Original Price:$59.50
Quantity:
Add To Cart
Active-Pro Debugger and Logic Analyzer
Sale Price:$395.00 Original Price:$495.00
Quantity:
Add to Cart
5-Pack of Active-Pro Debugger and Logic Analyzer
Sale Price:$1,795.00 Original Price:$1,995.00
Quantity:
Add to Cart

This tool is up there on my favorites list… so if you’re into hardware and firmware development, you must absolutely give this a try…”

- VOLTLOG YouTube Channel