
How to Bring-Up and Debug Your Embedded Circuit Board

Bring-Up and Debug Your Embedded Circuit Board FAST with the Active-Pro Debugger and Logic Analyzer for Embedded Firmware and Hardware Engineers
You’ve spent a great deal of time and effort designing a new board with all the bells and whistles you needed, like microprocessors, sensors, power supplies, interfaces to off board controls and displays, and other various gizmos that your end product needs.
You take the assembled board out of it’s shiny metallic anti-static bag and stare at it’s beauty and bask in the fact that you’re holding your design in your actual hands. You’re about to plug in power and turn on the device and it hits you - what if this doesn’t work? It is even safe to plug in the power?
Here are the steps that need to be taken to successfully bring up a new PCB that takes the minimum time, and produces the smallest amount of smoke!
Step 1 - Test for Shorts in Power and Ground
One sure way to create small mushroom clouds of smoke from non-suspecting capacitors is to have power rail shorts on your board. So the first thing to check is for shorts on your board between your power and ground signals..
With a Multimeter set to Continuity Test mode (often shown as a diode or ))) symbol for beeping) confirm that the Power Rails (Vcc, Vdd, +3.3V, 5V, or whatever you called them) to Ground are NOT shorted together. If you have multiple supplies and/or multiple grounds you need to test ALL of the combinations. Once they are all not shorted, you can move on to the next step.
Step 2 - Visually Inspect the Board
It doesn’t happen often when a board is professionally assembled but it does happen, and most likely when you’ve only made one board or you are on a tight schedule. I’m talking about parts that are mounted incorrectly, either shifted, rotated, or the completely wrong part.
Take the time and confirm the following for all components on your board:
Pin 1 is in the correct location on ICs
Diodes and polarized capacitors are pointing in the right direction
Components are on the pads and not shorting to adjacent pads
All part numbers are correct for the given reference designator
Step 3 - Apply Power and Check
Here is the anxiety part - time to apply the power. But first we need to connect an oscilloscope to the power rails so we can watch the power levels as we plug in the device, mainly to see if we need to unplug the board quickly! Today we use the Active-Pro to monitor the voltages in real-time as we turn on the power.
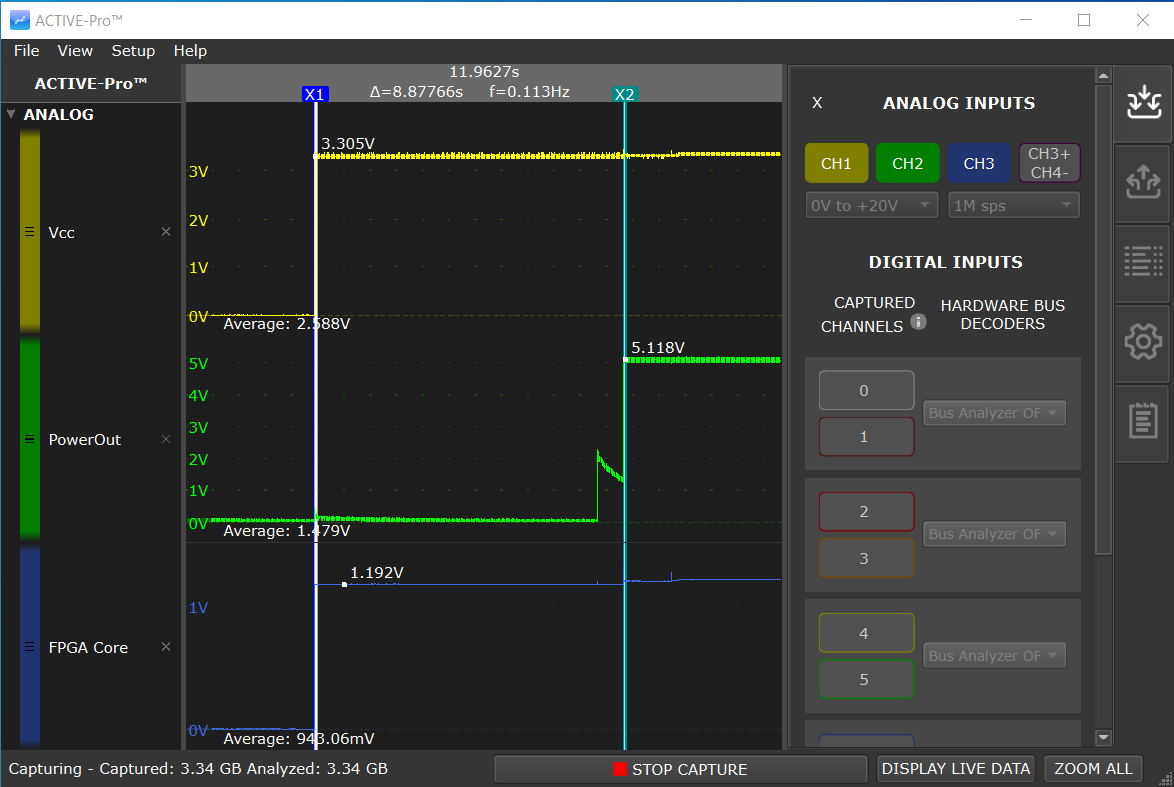
Watching the power rails with the Active-Pro while turning on the power for the first time
If you see the power voltages at the correct levels when the power is first applied like above, then you are good to move on. But if the power rails are not correct, unplug the board and start doing some power supply debug looking for component problems or design flaws.
Step 4 - Resets and Clocks
Now that the power is good, lets check that the chip resets and clocks are good going into your processors and/or fpgas. Power, Reset and Clocks are the three most important signals required by any microprocessor.
Using the Active-Pro we use the digital input channels to check the logic state of the resets, and the frequency of the clock.

Measuring Clock Frequency and Verifying Reset Levels
Step 5 - Processor Hello World with Debug Output
Once we know the power, clocks and reset are good to our processors, we can test that they are up and running using a simple application. We always setup our firmware projects to use the Active-Pro Debugger bus so that we can easily debug all of the processors, digital/analog signals, and system busses on the same screen.
Using the Active-Pro firmware here, we can output a basic “Hello World” for each microprocessor. In the following screenshot we output the name of the processor (Test Adapter or Monitor) and the version number first thing in main(). This confirms a number of basic things that are important to your embedded processor: your power connections to the processor are correct, the clocking setup is up and running, your build environment for your firmware is working correctly, and the programmer that programs your processor is configured correctly. You are also fully setup now to use the firmware debugging features of the Active-Pro for your entire firmware development project.
Having a running piece of firmware, at least the output of a “Hello World” type message, is critical to validating your hardware design. Below you can see the Active-Pro debug messages from our up and running processors (2 separate processors in this example) right after power on of the 3.3V Vcc line. And also see that the delay from power on to the first line in main() takes 6.9msecs.

Verifying Your Processor is Running with a “Hello World” Application (Active-Pro version)
Step 6 - System Bus Validation
Once the processors are up and running, you can then work on the communication between the processors and/or sensor ICs.
Getting these busses running is usually simple, once you have the voltage levels, baud rates, packet format and protocol signaling correct on both sides of the communication bus. While it is easy to say that, confirming it is often difficult. We use our Active-Pro to validate all of those parameters and confirm that the system is functioning as expected.
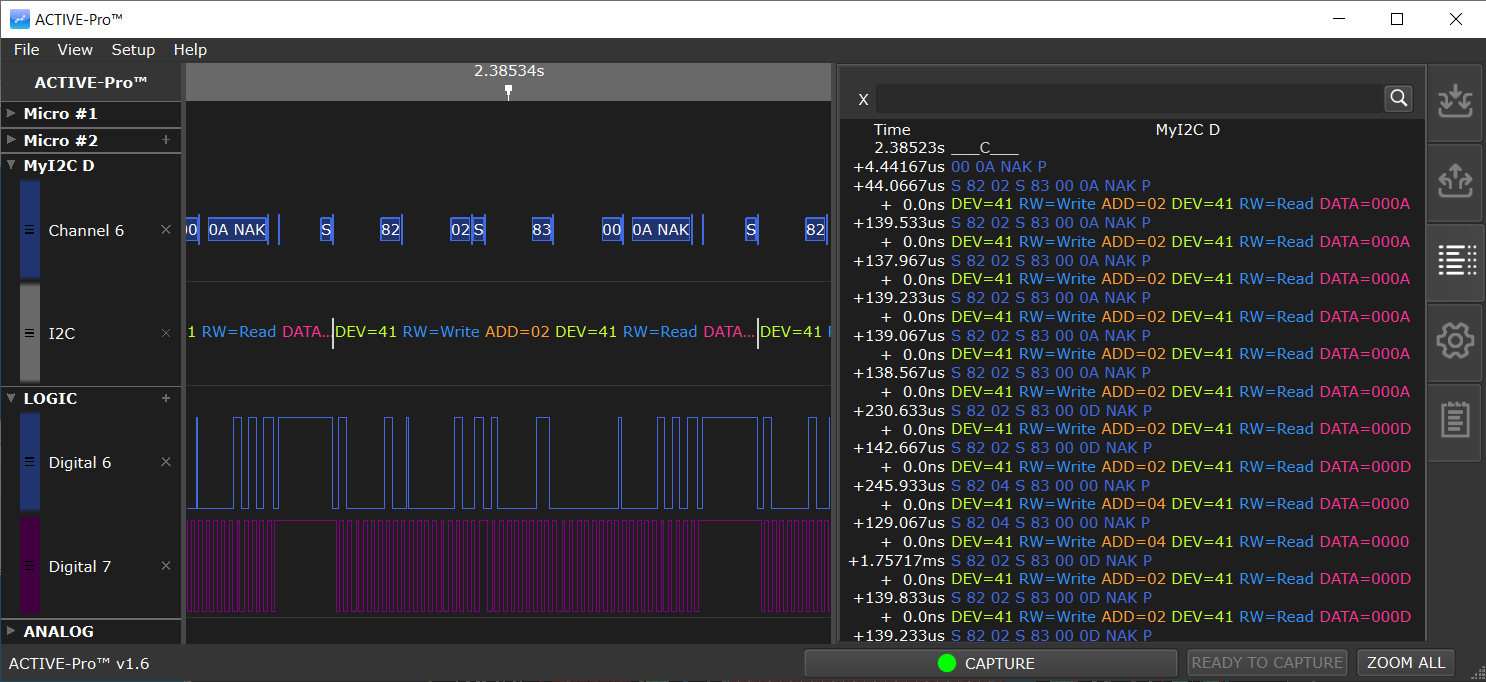
Decoding an I2C Bus with the Active-Pro (automatically detects SDA and SCL)
Step 7 - Now for the fun part…
Now the you have validated the core parts of your design, you can now work on the firmware for all of your processors, HDL FGPA code and test out your sensor performance (that is a fun issue left for another day). And now that you have the Active-Pro Debug Bus implemented your firmware development will be done with full visibility of what your systems firmware is doing in real-time, without breakpoints.

Active-Pro Showing Real-Time Operation of the Compete System
Multiple Processors, an I2C bus and digital logic lines and analog 3.3V Vcc Power Supply Rail
Conclusion
Using these simple steps and the right tools, you can bring up a new board quickly and easily. And if you use the Active-Pro Firmware Debugger and Logic Analyzer to do it, you are left with an extremely powerful firmware and hardware development system that lets you see the real-time operation of all processors, analog and digital signals, communication busses, packet and sensor data and even the dynamic current consumption of your device.
Happy Debugging!