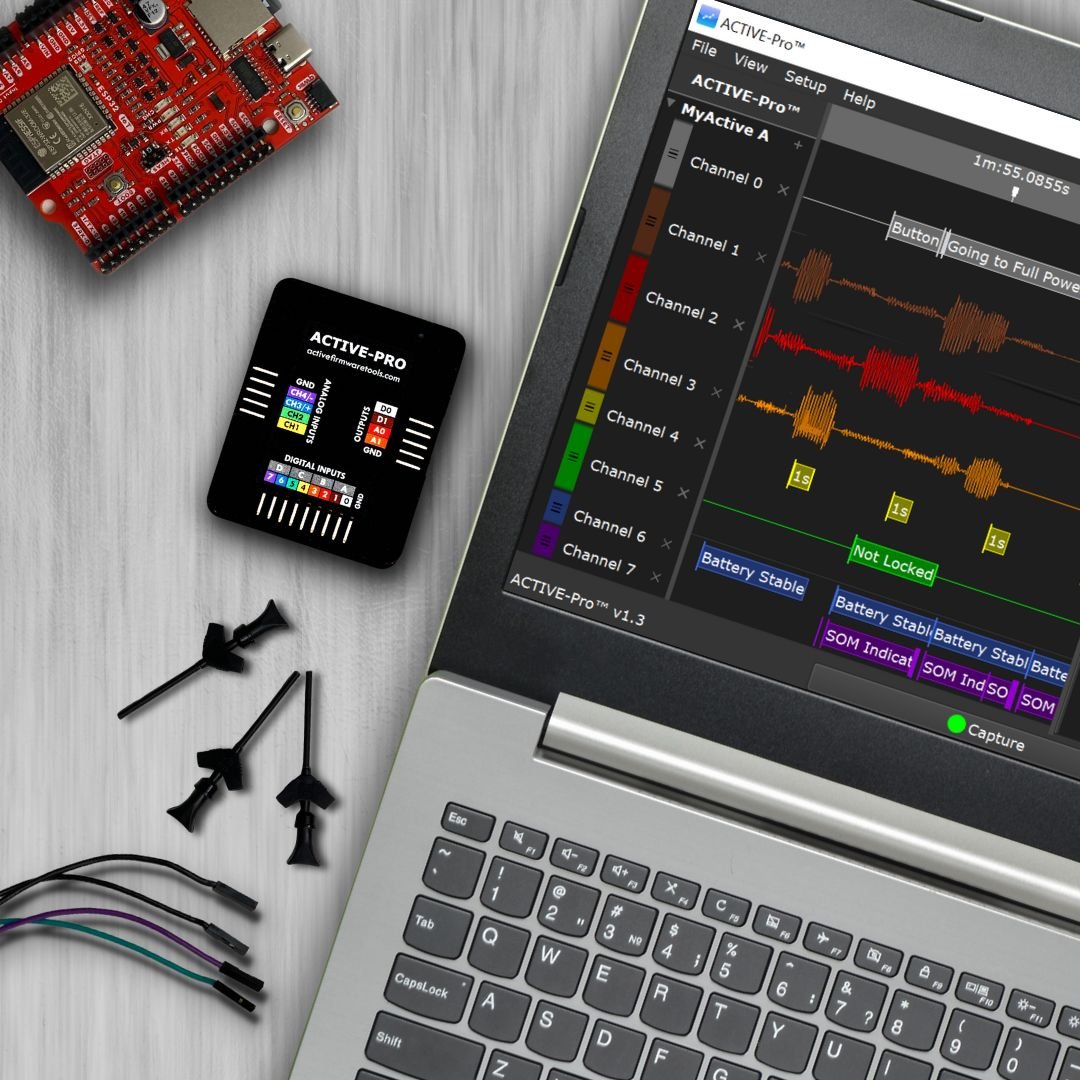
Unlock the Power of Real-Time Debugging: Instrumenting Your Firmware with the Active-Pro
Instrumenting Your Firmware For Success
In the fast-paced world of embedded systems development, every engineer knows that the ability to debug efficiently can make or break a project. Traditional methods like breakpoints often fall short in complex, real-time environments where pausing the system isn't an option. That’s where the true power of Instrumenting Your Firmware comes into play. With the Active-Pro, you can gain unprecedented insights into your code, catching bugs in real time without ever hitting pause. This article will walk you through the transformative benefits of this approach and show you just how easy it is to integrate into your next project.
Whether you're working on automotive control units, medical devices, or high-speed data acquisition systems, the Active-Pro is your gateway to faster debugging, more reliable systems, and a smoother path to market.
Benefits of Instrumenting Your Firmware
Real-Time Monitoring
Allows engineers to observe variables and system behavior in real-time without pausing the system.
Immediate Feedback
Instant visibility into the effects of code changes, enabling quicker debugging and development.
Non-Intrusive Debugging
No need to halt the system, maintaining the integrity of time-sensitive processes.
Enhanced Debugging Precision
Pinpoint the exact moment and cause of an issue within the running system.
Continuous Data Capture
Capture and analyze a continuous stream of data, which is critical for understanding complex issues.
Improved System Reliability
By catching and resolving issues in real-time, overall system reliability is enhanced.
Accelerated Development Cycle
Reduces time spent debugging, leading to faster project completion and deployment.
Better Understanding of System Behavior
Provides deep insights into how the firmware interacts with hardware in real-world conditions.
Reduced Time to Market
Faster identification and resolution of issues can shorten development cycles, getting products to market more quickly.
Adaptable to Various Systems
Suitable for complex, high-speed, and real-time systems where traditional breakpoints are impractical.
Easy Removal of Debug Code
The Active-Pro allows all debug statements to be removed with a single line of code, streamlining the transition from development to production.
Efficient Use of Hardware Resources
It can leverage existing hardware resources like SPI, UART, or SWV blocks to transmit data with minimal firmware overhead, preserving system performance.
Complete System Correlation
The Active-Pro can correlate firmware execution and activity with other real-world signals, buses, sensors, and current measurements, providing a comprehensive view of the embedded design.
Debug Output and GPIO Toggles
Traditional Methods of Instrumenting Firmware
Before diving into the advanced capabilities of the Active-Pro, it's important to recognize the traditional methods engineers have used to instrument firmware:
Debug Text Output
Whether to internal log files, or output over a bus to the external world, simple print statements that output data offer basic insights into firmware behavior.
Toggling GPIO Pins
A method where GPIO pins are toggled to signal specific events, typically monitored with an oscilloscope or logic analyzer for timing analysis.
LED or Embedded Displays
Indicating a state, or outputting debug information to an internal display gets the information to the engineer, with little or no correlation to the rest of the system.
How the Active-Pro Enhances Instrumenting Your Firmware
The Active-Pro not only supports traditional instrumentation methods like debug text output, GPIO toggling, and serial communication but also significantly enhances them with advanced capabilities:
Enhanced Debug Text and Variable Graphing Output
While you can still output debug text, the Active-Pro allows you to graph this data on multiple channels as well as live variables alongside other signals, providing a clearer, more comprehensive view of how your firmware is behaving in real time.
Integrated 120Msps Logic Analyzer and Oscilloscope
With the Active-Pro, signals from GPIO pins can be captured, analyzed, and correlated with other events in your system. The multi-channel capability enables you to monitor multiple GPIOs and other signals simultaneously, all within a unified interface.
Multi-Processor and Multi-Channel Analysis
The Active-Pro is ideal for multi-processor systems or complex designs involving multiple subsystems. It allows you to monitor and analyze signals from each processor and channel in real time, offering insights that traditional methods can’t match.
Comprehensive Data Correlation
The Active-Pro enables you to correlate debug data from multiple processors with real-world signals, sensor inputs, and other relevant system data. This gives you a complete picture of your system’s behavior, helping you diagnose and resolve issues more efficiently.
The Active-Pro makes instrumenting your firmware not just possible, but genuinely practical. It’s designed to have minimal impact on your system, so while you’re gaining deep insights, your firmware keeps running smoothly. With an easy setup process and intuitive tools, you can dive straight into debugging without dealing with complicated configurations.
Advanced filtering and analysis features help you focus on the critical data, cutting through the noise so you can spot and fix issues fast. The non-intrusive design means you make fewer changes to your firmware, lowering the risk of new bugs or altered behavior.
The Active-Pro also delivers precise timing, keeping your captured data in perfect sync with system events for reliable analysis. By leveraging hardware resources like SPI, UART, or SWV blocks, it transmits data with minimal overhead, maintaining performance even under heavy debugging loads.
By linking firmware execution with external signals, sensors, and buses, the Active-Pro gives you a clear, comprehensive view of your embedded design. This approach lets you analyze thoroughly and solve problems faster, ensuring your firmware is rock-solid and ready for production.
Steps to Instrument Your Firmware with the Active-Pro
Instrumenting your firmware with the Active-Pro is a straightforward process, thanks to the ready-to-use resources available here.. Below is a detailed guide on how to integrate the Active Debug Port into your firmware project, add instrumentation output statements, and the incredible insights you will gain when viewing the data in the Active-Pro Application.
1) Setup of the Active Debug Port
Download the Active Debug Port Source Code Modules
Go Here to download the source code.
Integrate the Source Code into Your Project
Add the downloaded source code files to your firmware project. This code is designed to be easily integrated with minimal adjustments needed. Simply pick the interface you would like to use.
Connect Your Hardware to the Active-Pro
Wire up the Active-Pro to your target system, using one or two wires based on the Active Debug Port interface you have chosen in the firmware above.
This only has to be done ONCE for any given firmware project.
2) Send Out the Data You Need
Once the Active Debug Port is integrated, adding instrumentation output statements to your code is as simple as adding a single line. Below is an example of how to do this:
    ACTIVEprintf(0, "Invalid Command Received: 0x%02X", Command );  // We received an invalid command

    ACTIVEprintf(2, "State: %d", state);   // Current State of Firmware

    ACTIVEText(1, "Got $GPZDA");           // GPZDA Event Occured

    ACTIVEValue(5, batlevel);              // Graph the real-time battery level
3) See Your Entire Design on the Active-Pro Application
After configuring your system and adding the instrumentation, the real magic happens when you start seeing your data live in the Active-Pro Application. Here’s what you can expect:
Real-Time Variable Monitoring
Watch your variables update in real-time as your firmware runs, giving you immediate feedback on system behavior.
Firmware State Visualization
Track the execution path and states within your firmware, helping you quickly identify any unexpected behavior.
Sensor and Bus Data Visualization
View and analyze sensor values, bus transactions (I2C, SPI, UART), and other signals alongside your firmware’s execution, providing a holistic view of your system’s performance.
Channelized Textual Debug Output
Receive detailed textual debug output directly from your firmware, making it easier to diagnose and resolve issues.
Exact Timing Correlation Between Firmware, Hardware and external Stimuli
View debug output from multiple processors, multiple communication busses, analog and digital logic signals, sensor outputs, and dynamic current measurements to get the real picture of what your design is doing.
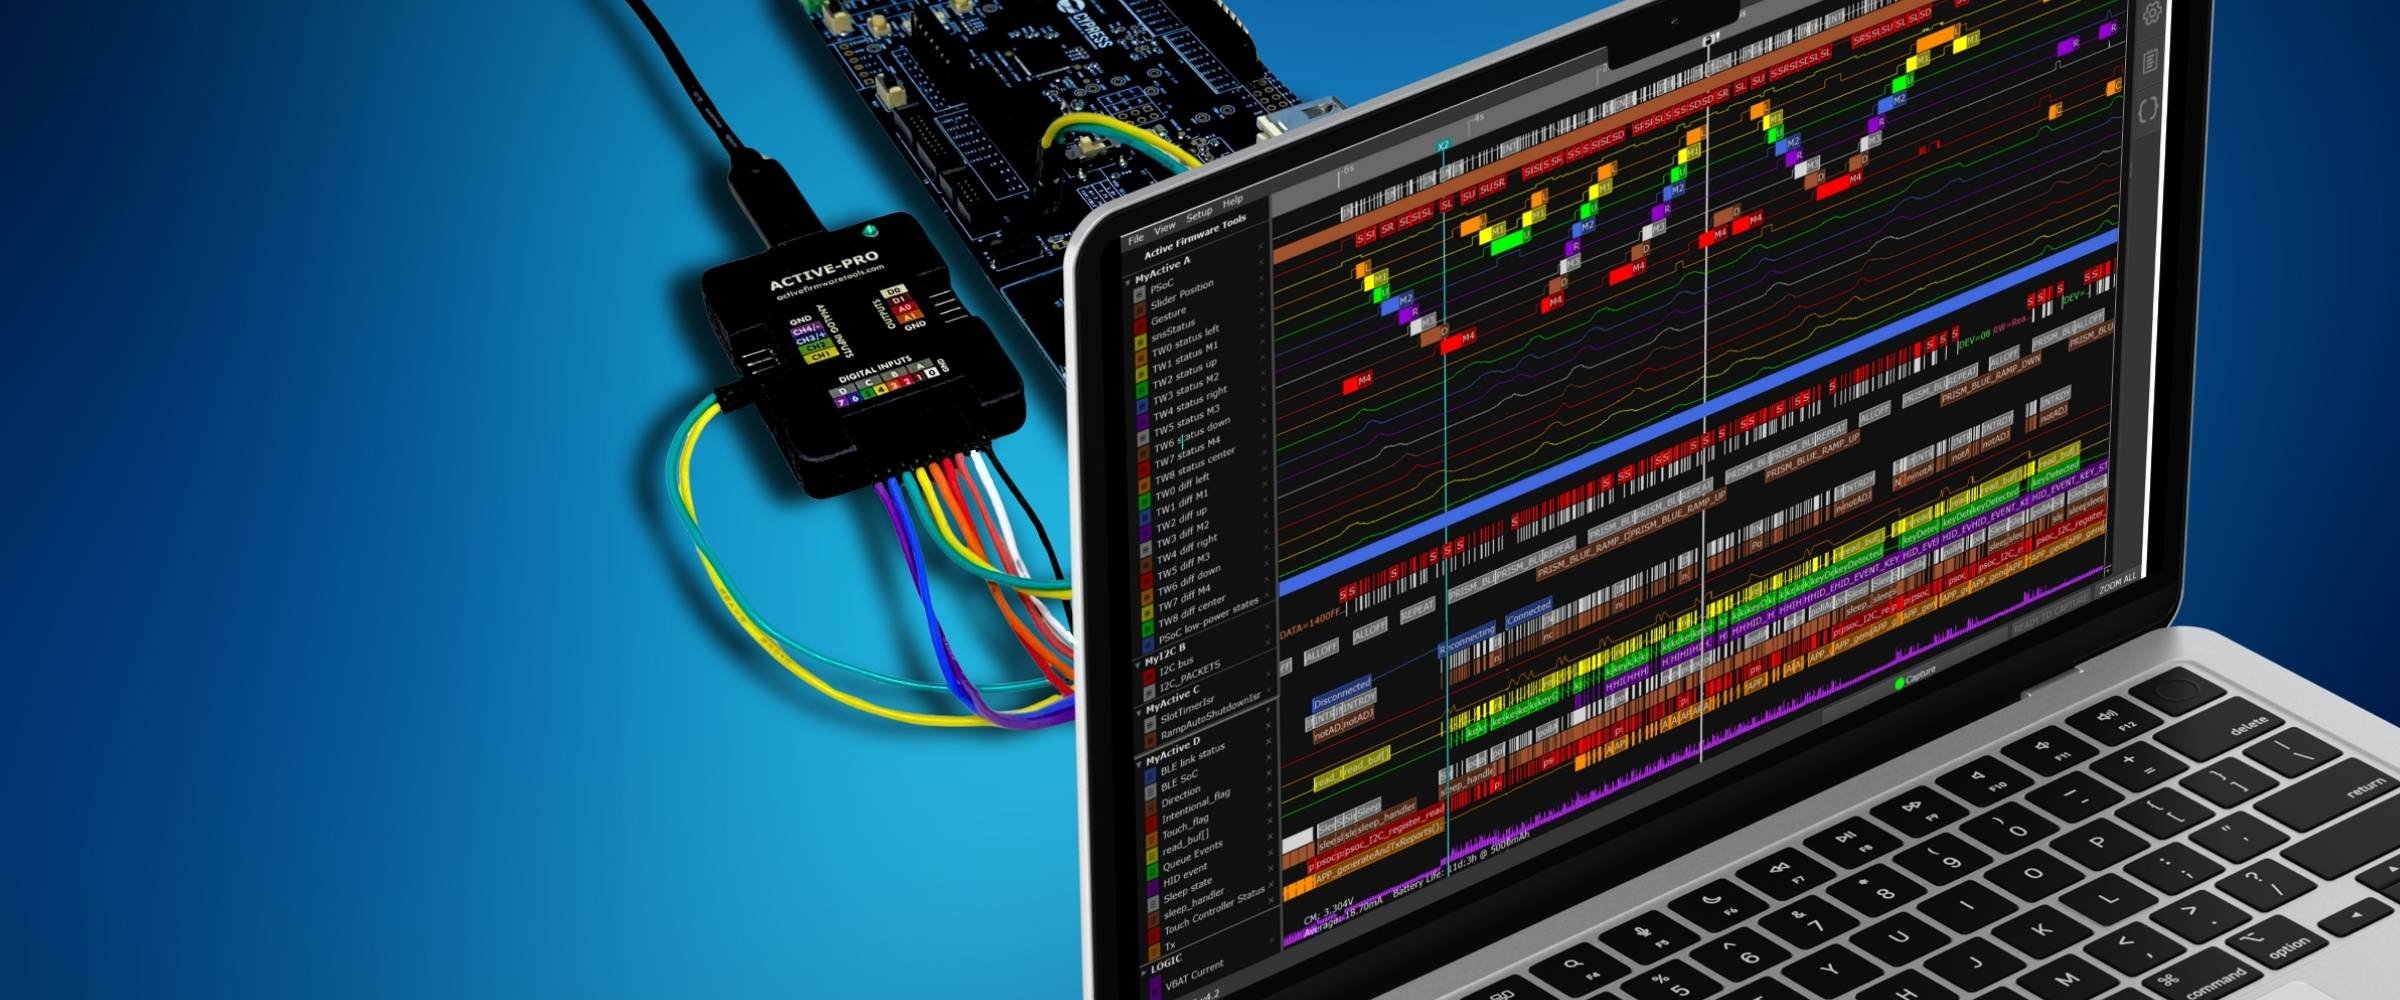
All of these insights are available on a single screen within the Active-Pro Application, enabling you to see the complete picture of your embedded design at a glance.
For more detailed instructions and additional examples, visit the Users Manual here. This will guide you through every step, ensuring a smooth and effective integration into your firmware development process.
Active-Pro Details Your Entire Embedded System
Instrument Your Firmware to Make You Successful
In the end, instrumenting your firmware with the right tools can be crucial for your debugging process. By using a solution like the Active-Pro, you can gain deep insights into your firmware without compromising performance. With precise timing, advanced data filtering, and a non-intrusive approach, you can see the whole picture of your embedded design. Instrumenting your code not only gives you a deeper understanding of your system's real-time performance but also helps you spot issues as they happen, saving you valuable time and ensuring a more reliable product. This is more than just a debugging technique—it's often times the only way you will see your bug’s root cause in action, especially in real-rime complex systems where breakpoints are just not an option.
Active-Pro® Debugger and Logic Analyzer
See the Data You’ve Been Missing
Solve Your Bugs Faster
Become the Expert of Your Design


