Trace Events to Source Code
Overview
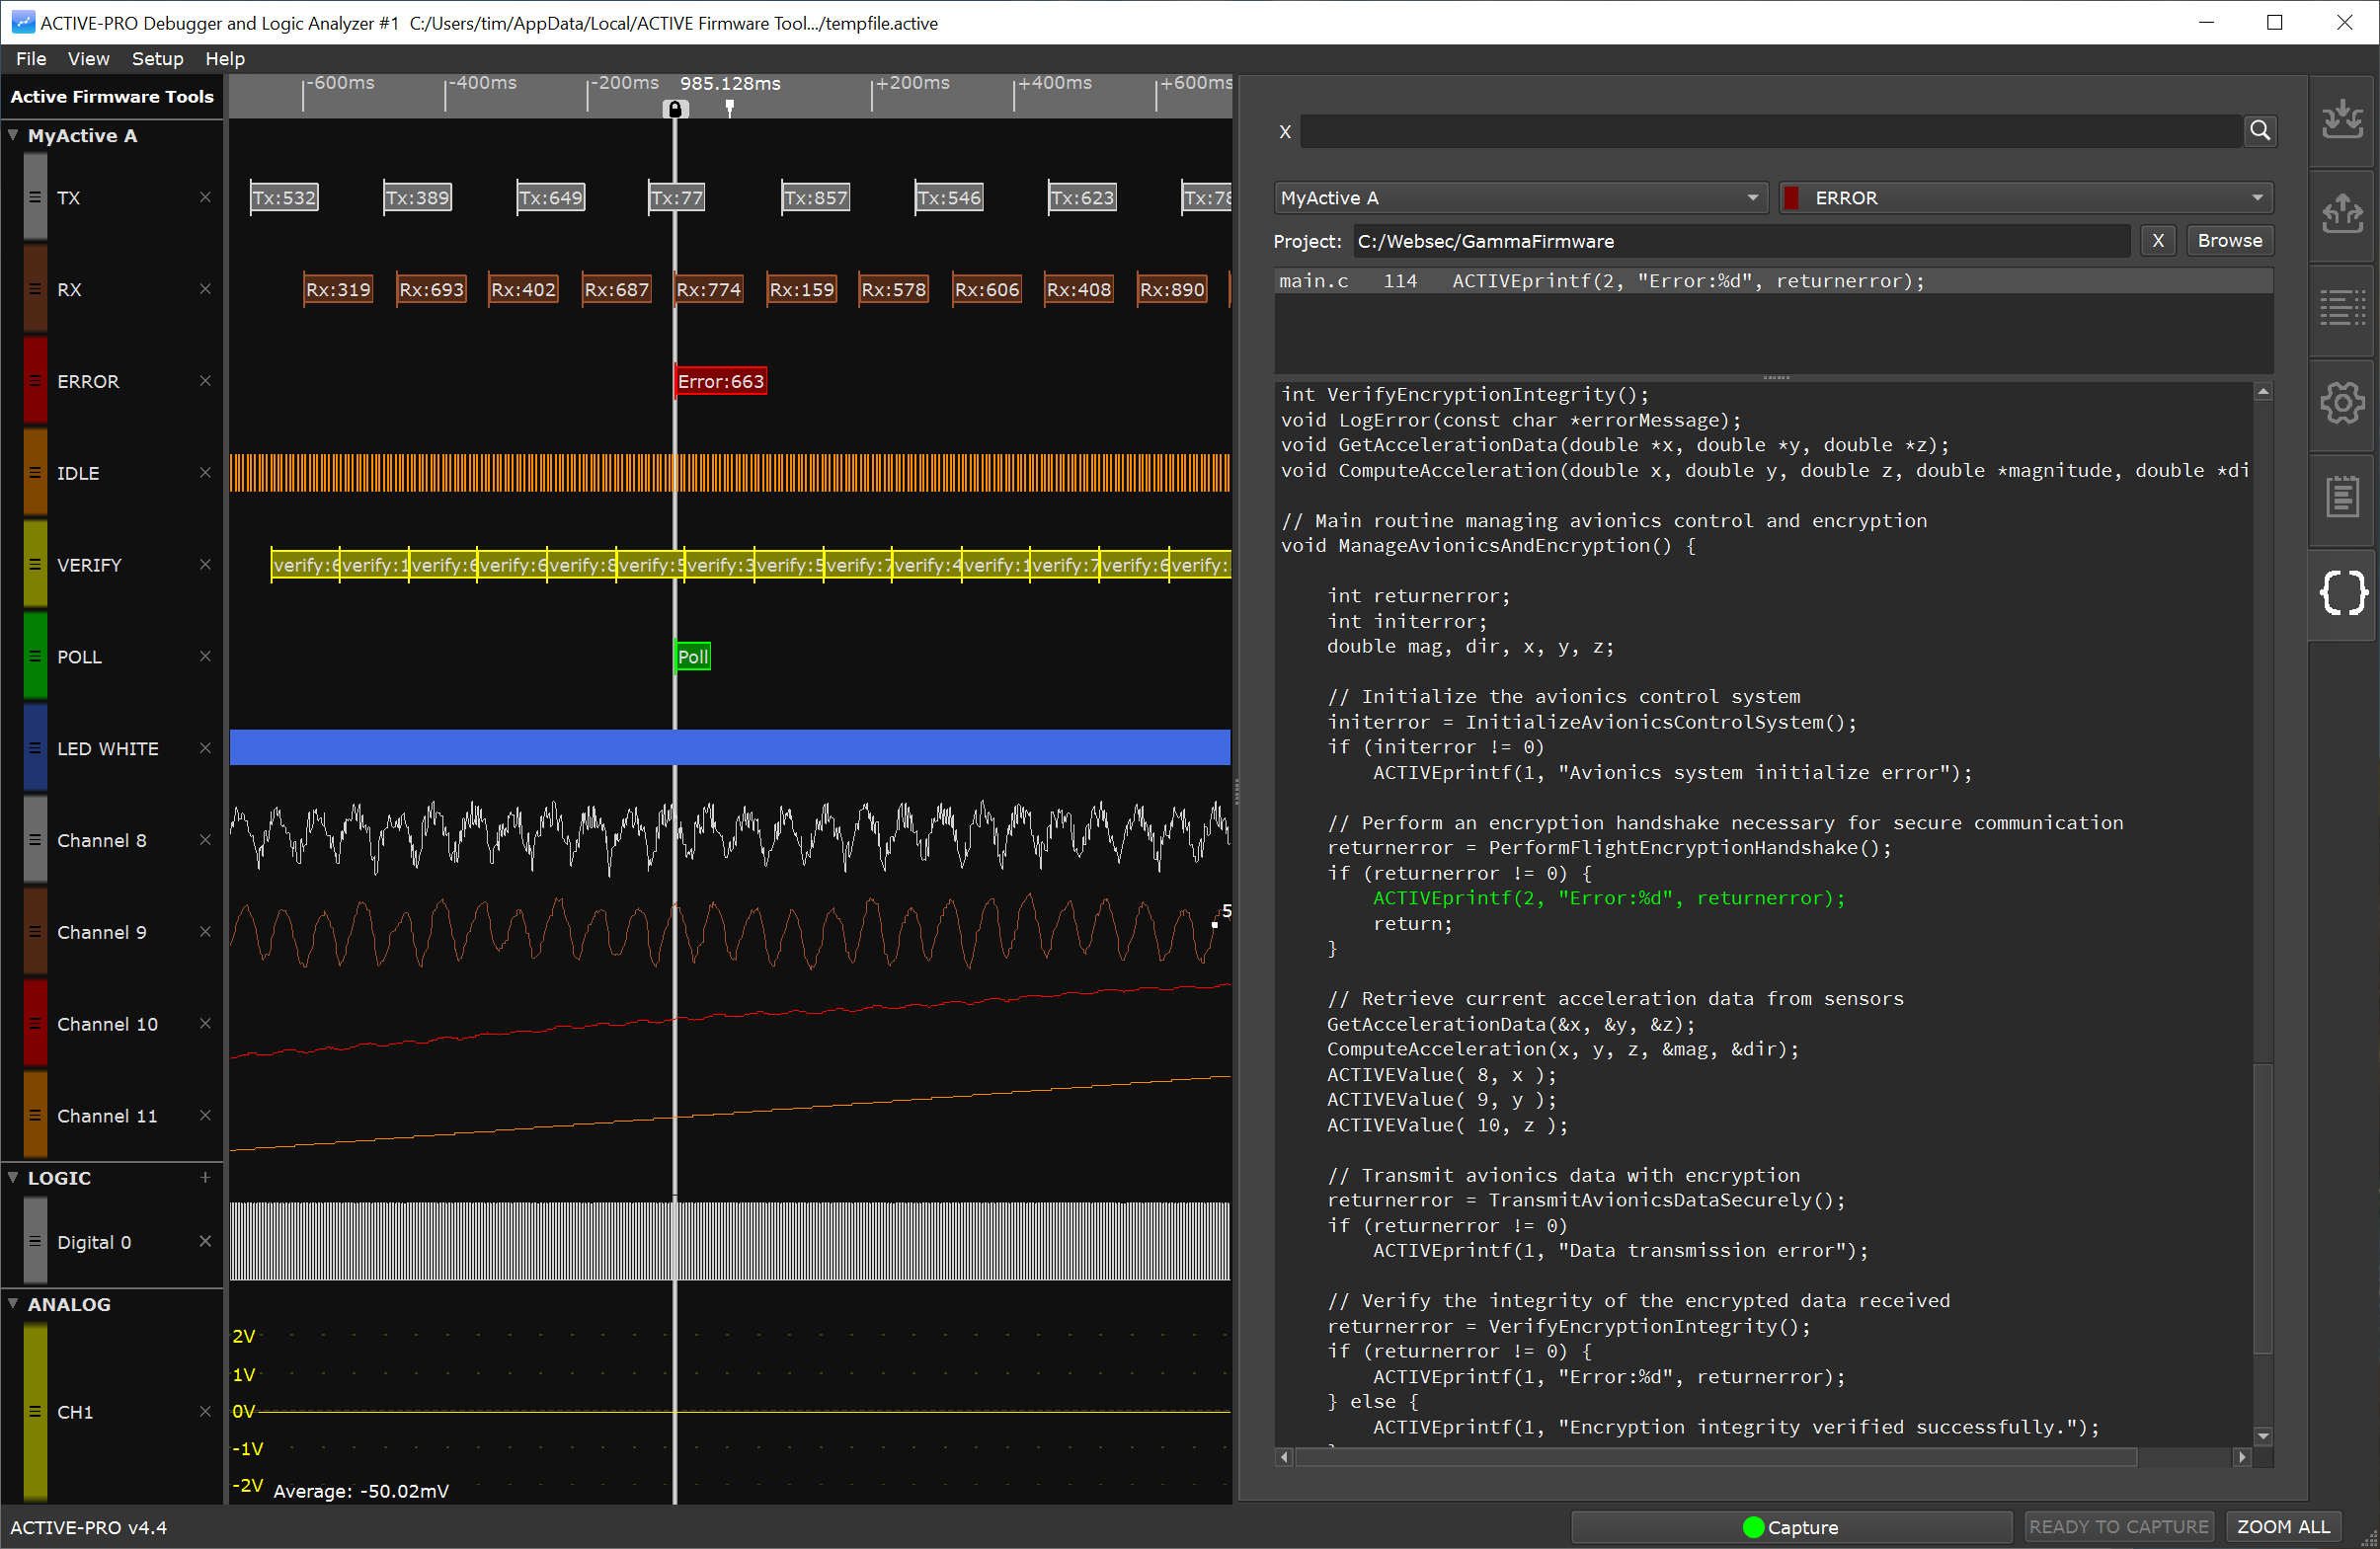
The Trace Events to Source Code feature links trace events from the waveform analyzer to the corresponding source code lines.
Interface Components
Waveform Display: Shows trace events across various channels such as TX, RX, and ERROR.
Active Debug Port Devices ComboBox: Located at the top-right, select from a list of devices configured to use the Active Debug Port.
Active Debug Port Channels ComboBox: Choose from available channels for the selected device.
Source Code Directory: Input the directory path of the source code for the device’s firmware project.
Data Output Locations List: Displays all locations within the firmware where the selected device outputs data to the chosen channel.
Source Code Viewer: Displays the source code file corresponding to the selected output location, highlighting the exact line of code responsible for the output.
Setup Process
Select Your Device: From the Devices ComboBox, choose your device.
Select the Channel: Use the Channels ComboBox to select the desired channel.
Set the Source Code Directory: Click "Browse" to locate and set the directory containing your device's firmware source code.
View Data Output Locations: The list below the directory input will show all firmware locations where data is output to the selected channel.
Linking Trace Events to Source Code
Interact with the Waveform: Right-click on a line in the waveform trace that shows debug data for an Active Debug Port device and select Show Source Code from the context menu.
Code Examination: The Source Code Viewer will automatically highlight the relevant line of code, giving you immediate insight into the source that created the selected debug item in the waveform.

